Labs
- Using the
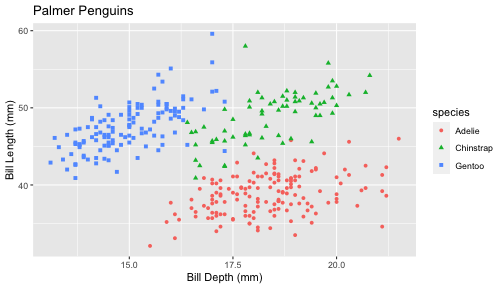
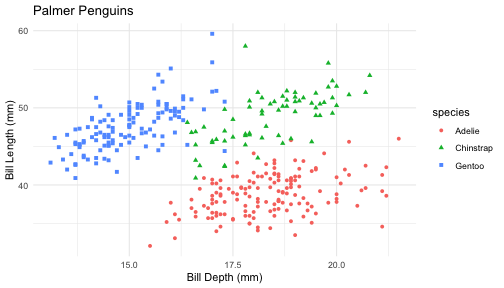
penguinsdata, - Map
bill depthto x-axis,bill lengthto y-axis,speciesto shape. - Add a layer of points and set the size of the points to 4.
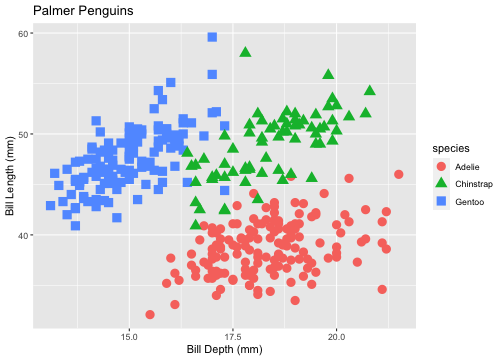
- Add labels to x-axis (Bill Depth(mm)), y-axis (Bill Length(mm)), and the title of the plot (Palmer Penguins).
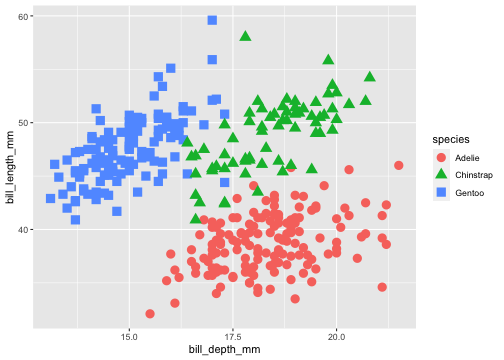
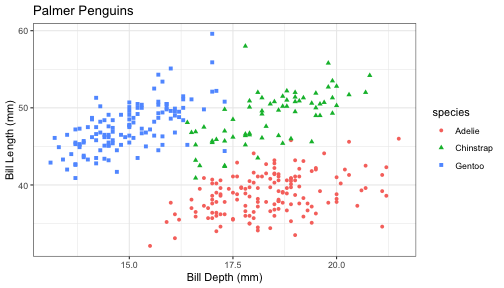
ggplot(penguins, aes(x = bill_depth_mm, y = bill_length_mm, shape = species, color = species)) + geom_point(size = 4) + labs(x = "Bill Depth (mm)", y = "Bill Length (mm)", title = "Palmer Penguins")ggplot(penguins, aes(x = bill_depth_mm, y = bill_length_mm, shape = species, color = species)) + geom_point() + labs(x = "Bill Depth (mm)", y = "Bill Length (mm)", title = "Palmer Penguins") + theme_bw()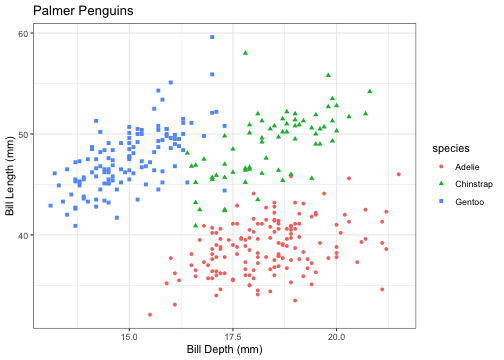
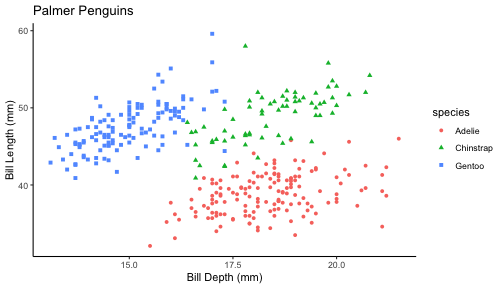
ggplot(penguins, aes(x = bill_depth_mm, y = bill_length_mm, shape = species, color = species)) + geom_point() + labs(x = "Bill Depth (mm)", y = "Bill Length (mm)", title = "Palmer Penguins") + theme_bw() + theme(text = element_text(size=20))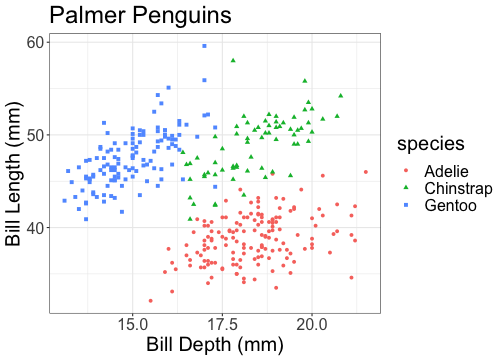
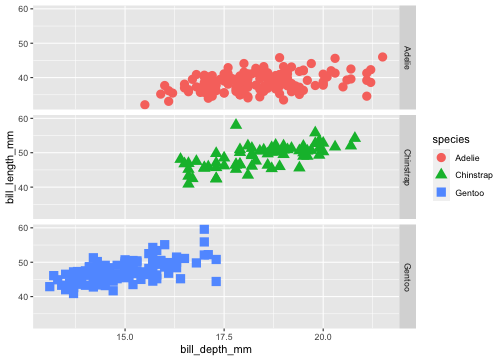
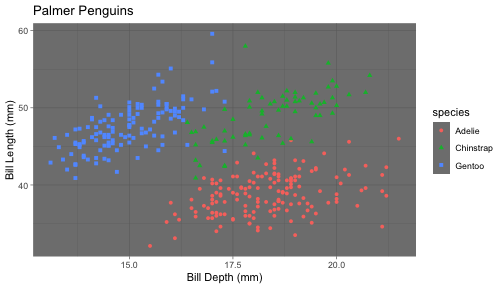
ggplot(penguins, aes(x = bill_depth_mm, y = bill_length_mm, shape = species, color = species)) + geom_point(size = 4) + facet_grid(.~species)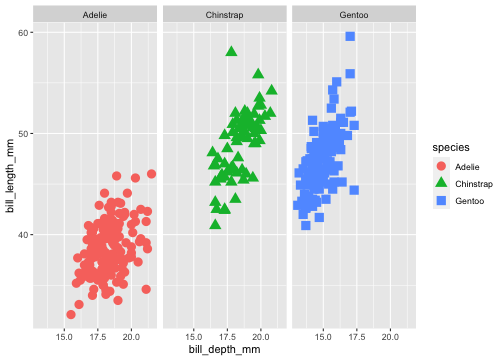
ggplot(penguins, aes(x = bill_depth_mm, y = bill_length_mm, shape = species, color = species)) + geom_point(size = 4) + facet_grid(species~.)